Welcome to Star-Field's Solar Headquarters
If you've been hearing about solar flares, geomagnetic storms, and "Solar Cycle 25" in the news and wondering what any of it means — you're in the right place. This guide is your welcome center: a plain-language orientation to solar cycles, the vocabulary of space weather, and how to use the tools on this site to track what the Sun is doing in real time.
What Is a Solar Cycle?
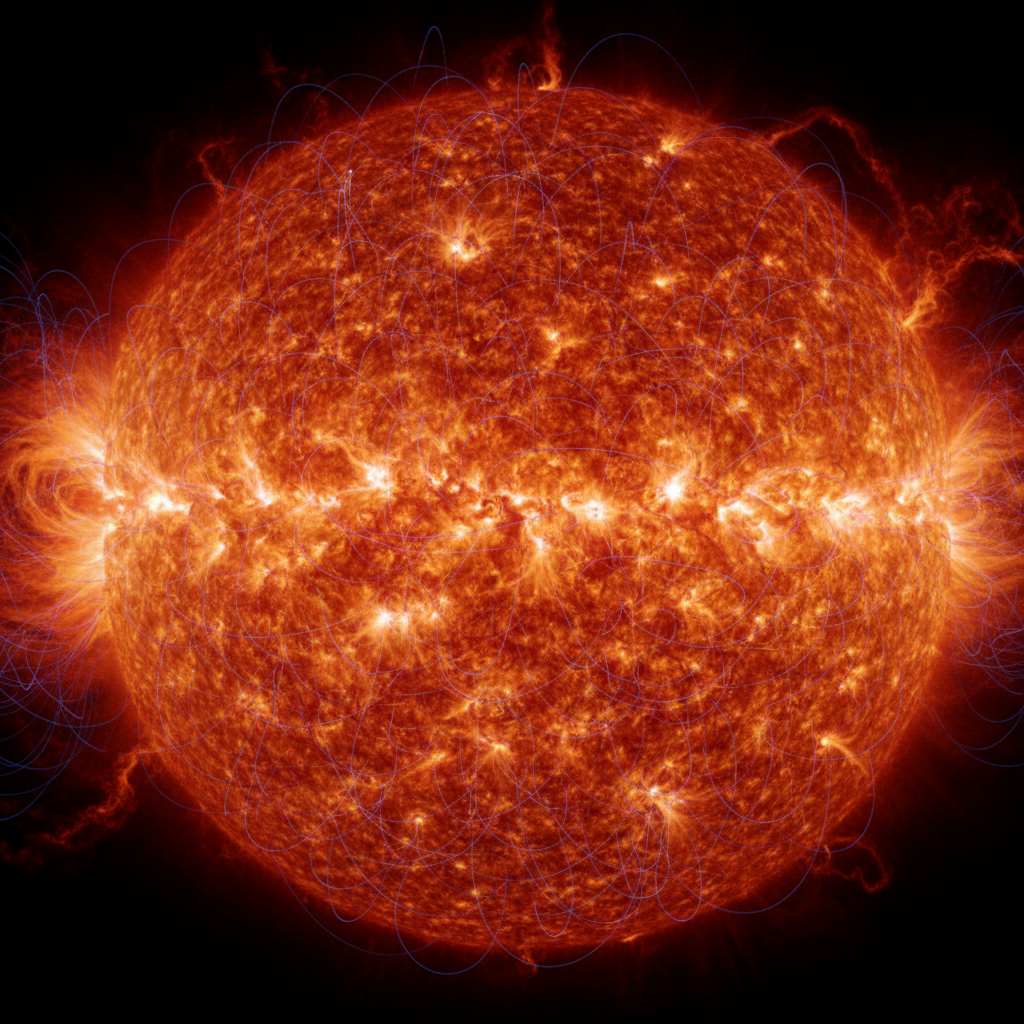
The Sun doesn't shine at a constant level. Its magnetic activity rises and falls on a rhythm that lasts roughly 11 years, driven by the slow churning of its interior. During the quiet phase — solar minimum — sunspots are rare and flares are infrequent. During the active phase — solar maximum — the Sun's surface becomes pocked with dark sunspots, and it erupts with flares and coronal mass ejections that can rattle Earth's magnetic field.
This 11-year heartbeat is called a solar cycle. We've been watching it closely since the mid-1700s, and each cycle gets a number.
Why "Solar Cycle 25" — It's Not About the Year 2025
The most common confusion: people hear "Solar Cycle 25" and assume it means the year 2025. It doesn't. Solar cycles are numbered sequentially starting from 1755, which was designated Cycle 1. Solar Cycle 25 simply means it's the 25th cycle since we began counting.
Cycle 25 began in late 2019, during a period of deep solar minimum. It's expected to peak (reach solar maximum) around 2024–2025, and then decline toward its minimum around 2030 — at which point Solar Cycle 26 will begin.
Solar Weather Terminology — A Plain-Language Glossary
Solar Flares (A, B, C, M, X)
A solar flare is a sudden, intense burst of radiation from the Sun's surface. They're classified by their X-ray brightness on a five-tier scale:
- A-class — Barely detectable. Background noise.
- B-class — Very small. No Earth impact.
- C-class — Small. Minor effects, mostly unnoticed by the public.
- M-class — Medium. Can cause brief radio blackouts at the poles.
- X-class — Extreme. Can trigger planet-wide radio blackouts, radiation storms, and — if aimed at Earth — geomagnetic storms.
(Yes, the C, M, and X naming is a coincidence — not a sponsorship from a certain German automaker, though it does make the scale oddly easy to remember.)
Each class is further divided by a number: an X3 flare is three times stronger than an X1. The scale is logarithmic, so an M2 is ten times brighter than a C2.
Coronal Mass Ejections (CMEs)
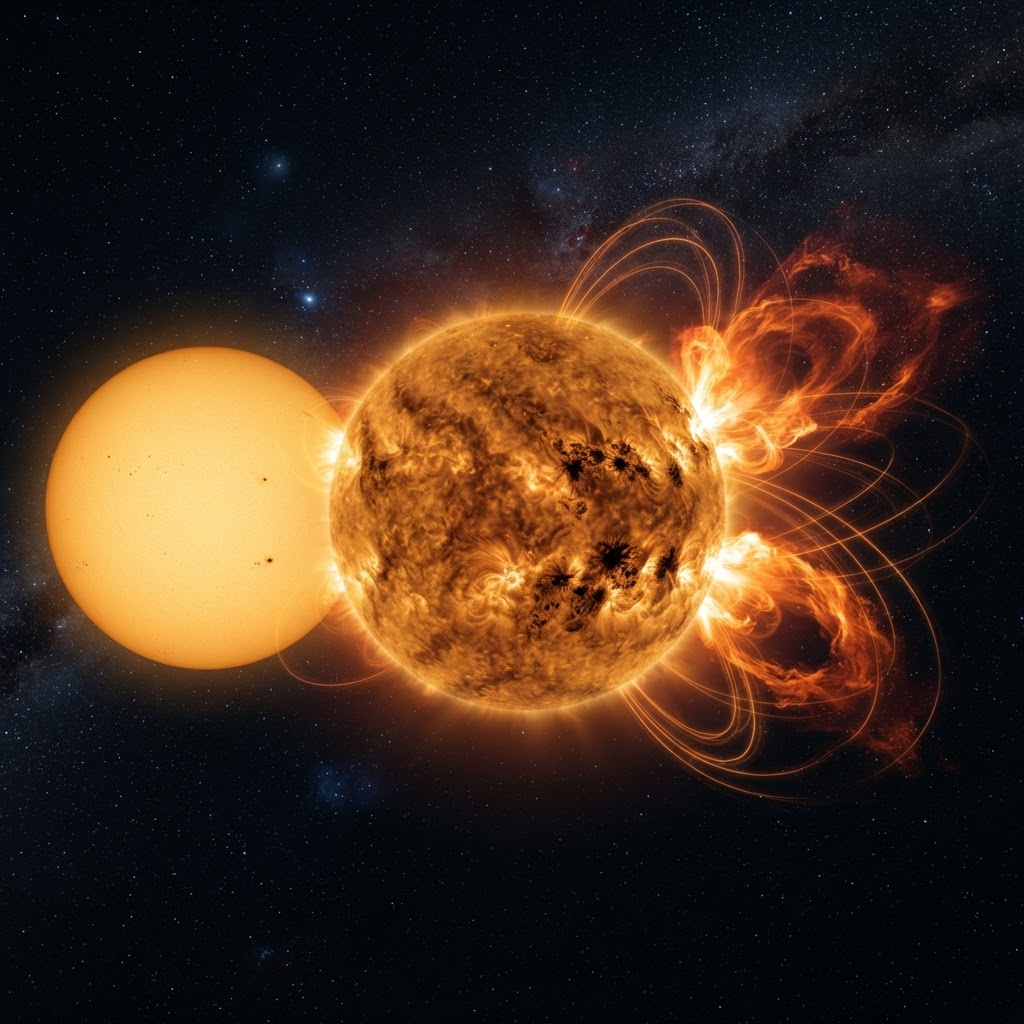
If a solar flare is a flash of light, a coronal mass ejection is a cannon shot. A CME is a massive blob of magnetic plasma hurled from the Sun into space. When one is aimed at Earth, it arrives 1–3 days later and can compress our magnetic field, triggering geomagnetic storms. Not all flares produce CMEs, and not all CMEs come from flares — but the combination is what makes space weather dangerous.
Solar Wind
The Sun constantly bleeds a stream of charged particles — the solar wind. It flows past Earth at roughly 400 km/s during quiet times. When a CME arrives, the wind can surge to 700+ km/s, and that's when things get interesting (and sometimes disruptive).
Kp Index
The Kp index is a global measure of geomagnetic disturbance, rated 0–9. Think of it as a "how rattled is Earth's magnetic field right now" dial:
- Kp 0–2 — Quiet. Nothing happening.
- Kp 3–4 — Unsettled. Aurora creeps toward high latitudes.
- Kp 5+ — A geomagnetic storm is underway.
Geomagnetic Storm Scale (G1–G5)
NOAA translates Kp into a five-level storm scale:
- G1 (Kp 5) — Minor. Aurora visible at high latitudes. Minor power grid fluctuations.
- G2 (Kp 6) — Moderate. Aurora pushes further south. HF radio fades at high latitudes.
- G3 (Kp 7) — Strong. Aurora widely visible. Voltage corrections needed on power grids. Satellite orientation issues.
- G4 (Kp 8) — Severe. Aurora as far south as Alabama. Power grid protective systems trip. GPS degraded for hours.
- G5 (Kp 9) — Extreme. Aurora visible at the equator. Widespread voltage control problems. Grid systems may collapse in places.
How to Read the Star-Field Dashboard
The Solar Cycle 25 Hub on this site pulls live data from NOAA's Space Weather Prediction Center and renders it in three core charts. Here's what each one tells you:
Solar Wind Speed
This red area chart shows the speed of the solar wind in km/s over the last few days. When the line jumps above ~600 km/s, a CME has likely arrived. The dashed threshold line marks where things get interesting.
Planetary K-Index (Kp)
This bar chart shows the Kp index over the last 24 readings (each ~3 hours apart). When bars cross the orange dashed threshold, a geomagnetic storm is building. The color and height tell you how severe.
X-Ray Flux
This blue area chart shows the Sun's X-ray output on a logarithmic scale. The horizontal reference lines mark the flare classes: M (orange) and X (red). When the blue line spikes above the M line, a moderate flare is happening; above the X line, it's extreme.
Above the charts, the highlights strip gives you the current snapshot: the latest flare class, solar wind speed, Kp index, and geomagnetic storm status — all color-coded by severity.
Solar Cycle 25: The Surge That Outran the Forecast
Here's the part that makes this cycle special. Before Solar Cycle 25 began, the prediction panel convened by NOAA and NASA forecast a quiet cycle — comparable to the deep minimum of Cycle 24. They expected a peak sunspot number around 115.
They were wrong. Cycle 25 has instead produced some of the strongest solar activity in two decades. Sunspot counts have blown past predictions, X-class flares have become routine, and the May 2024 "Gannon storm" (G5, the highest level) lit up auroras as far south as Mexico and Puerto Rico — the most extreme geomagnetic storm since 2003.
This matters beyond the spectacle. It exposed the limits of our forecasting models. If we can't predict the intensity of a solar cycle, we can't fully prepare the power grids, satellites, and communication systems that are increasingly vulnerable to space weather.
Solar Cycle 26: Coming Around 2030
Solar Cycle 26 is expected to begin around 2030, as Cycle 25 winds down toward its next minimum. Early predictions are already being debated, and the big question hanging over them is the one Cycle 25 just made urgent: can we trust the models?
Some researchers are calling for a return to a quieter cycle — a "Gleissberg minimum" — based on long-term patterns. Others see the underestimation of Cycle 25 as evidence that the dynamo models used to predict solar activity are missing something fundamental about how the Sun works. The honest answer: we don't yet know whether Cycle 26 will be quiet or loud, and the uncertainty itself is the science.
Star-Field will be tracking every flare, every CME, and every model revision as we approach the transition. This is the place to watch.
Get Email Alerts When the Sun Erupts
If you want to know the moment something significant happens — an X-class flare, a major geomagnetic storm — Star-Field offers a free email alert service. You choose your own threshold: get notified for M-class flares and up, or only the rare X-class events. Set it to whatever level you consider "worth knowing about."
→ Set up your solar weather alerts here
The alerts are rare and pertinent — we only email you when the Sun actually does something that crosses your threshold, not on a schedule. During solar maximum you might get a few per month; during quiet periods, weeks of silence. You can set your email client to flag these as high-priority if you want to be pinged the moment they arrive.
Your Solar Cycle 25 Headquarters
This is the hub. From here you can:
- Watch live solar weather data from NOAA
- Read deep dives on the science behind the headlines
- Catch up on the latest findings across the electromagnetic frontier
- Get email alerts when the Sun does something worth your attention
Welcome to Star-Field. The Sun is doing more than it has in two decades — and we're watching it closely.